 Abstract:
This experiment is about dice probability which examines the result of rolling a pair of dice hundred times and record the result of each trail. It explains the concepts of probability by using the dice rolling game that shows the result and the probability of the experiment overall. For this experiment I wrote a program using Java programming language that rolls the dice hundred times and it prints out the result on the screen in less than a second. It prints out the hundred trails with the values of each dice and their sums. The code organized a table that has four columns: number of each rolls, dice1, dice2 values, and the sums. According to my experiment results the most frequent sum is seven, the least frequent sum is two, the time complexity of counting the frequent sums is a minute, and the time complexity of the overall program is big Oh of n which written as O(n). The probability distribution of the experiment is 1/36, since each dice has six sides therefore with two dices it will be 36 sides. According to the study of “The Probability Distribution of the Sum of Several Dice: Slot Applications.” It shows the probability distribution table of the sum after rolling a fair pair of dice by using the probability distribution function; it also uses the moment generating function. The probability distribution function which shows the sample space of the experiment and it the moment generating function which is uniquely determines the distribution.
Introduction:
The first question that would come up to our mind is what is probability? The simplest definition of probability is, it is the study of the mathematics of calculating the likelihood that particular events will happen. Probability is made of three main steps: Experiment; which is a repetitive procedure that ends up having the best possible outcome, Sample Space and Event; Sample space is the distribution of the experiment; event is a subset of the sample space, and Probability Function, which is a function giving the probability for each outcome. Now we have understood the concept of probability that will help us to understand the result of the experiment. For this experiment we will roll a pair of dice hundred times. There are six sides on each dice which means that each dice will have six different possible outcomes for each trail, and that will be repeated hundred times. I have written a program using Java programming language that computes the sum of each trail hundred time, the program took less than a second to show the results on the screen. It shows the most repeatable sum, the least repeated sum and the probability of the experiment over all.
Materials:
Laptop
IntelliJ IDEA A software application for Java Programming Language
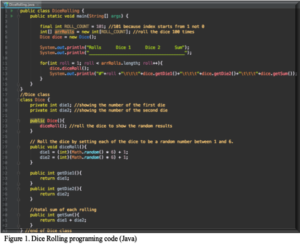
Figure 1 shows the code I wrote in IntelliJ IDEA
Methods:
Java is one of the Object-Oriented Programming (OOP) languages that refers to a specific instance of a class, this class contains variables, methods, and data structures that can be used as many as needed.
This program is made of two classes:
Dice class, is assigned to roll the dices and come up with random out comes. It contains the following:
Two private variables: dice1 and dice2; private means dice class can only access them.
Five methods:
Dice(), is a method called constructor which gives an access to the main class to roll the dices. It is usually placed at the top of the class that contains private variables and methods.
diceRoll(), is a method that does the experiment and comes out with random values each trail.
getDice1() and getDice2() do the same job, they return the values of the dice each time it is rolled.
getSum(), is a method that returns the sum of the pair of dice each time diceRoll() method executes.
Main class, is the essential part of the program and it includes the following:
Main method, is a method that java programs cannot be implemented unless it has the it. The main method includes:
An array called arrRolls, and its length the numbers of rolling which I defined as ROLL_COUNT.
An object called dice to give an access to Dice class.
Print statement to print a chart of the results on the screen.
A for loop that goes through the array hundred times, it also calls the diceRoll() method then it prints the result.
Results:
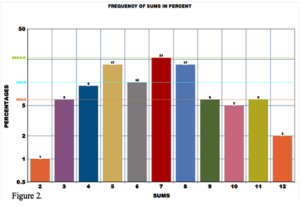
As a result, we can observe that the frequent sum of the hundred rolls is seven which was repeated 21 times out of 100. The least frequent sum is two and it was repeated only once. The bar graph below will show the distribution of frequency of the sums with the mean, median, mood.
According to “The Probability Distribution of the Sum of Several Dice: Slot Applications.” The probability distribution of the sums is represented on Table 1.
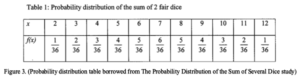
The probability of the sums shows that each number will have different possible outcomes each trail.
The results of the study are corresponded to the bar graph above is computed as the following table shows.
The results of Java program are shown in appendix.
Analysis:
Going back at the purpose of the experiment we can see that the results has proved its hypotheses; which finding the most and least frequent sum after rolling the pair of dice hundred times. The program I wrote has shortened the time it would have taken if I rolled the dices manually (Figure 1.). In programming, the time complexity is written as O(n), it can be read as big is big Oh of n, that means the program will run n times depending on the number of trails. I manually counted the frequency of the sums and it took me a minute to count it, however, counting the most and least repeatable numbers of each dice took me 5 minutes. In Figure 2. I calculated the mean, median, and mode. Mean is the average of the numbers which calculate by using the formula shown below: μ=∑▒x_i/n=100/12=8.3.
The Median is the value separating the higher half from the lower half of a data sample, it has two ways to compute it: if the numbers are odd then the middle number will be the median which in our case is seven, if the numbers are even then this is the formula need to be used: Χ= (n+1)/2.
The Mode is the number that appears most often, so in this case the mode of the sums will be six because it is the most repeatable number as shown in Figure 2.
According to the study and the experiment, the data approaches normal distribution and the probability distribution function of this data is given by f(x)={█(1/6^k x=1,2,…k@0 otherwise)┤ where k is the number of the dice which in this case is 2, then the function will be as the following: f(x)={█(1/36 x=1,2,…,12@0 otherwise)┤
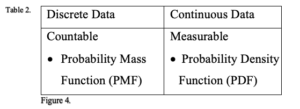
This experiment has discrete data because it is countable so we used the Probability Mass Function (PMF) to compute the probability as the following formula: f(x_j )=P(X=x_j )=p_j,j=1,2,…,k.
In this case it equals to the following: f(x_12 )=P(X=x_12 )=p_j,j=1,2,…,12
The moment generating formula which by definition is a function that uniquely determines the distribution given by the following equation: M_s (t)=1/6^k 〖(e^t+e^2t+⋯+e^6t)〗^k.
The study has also showed how to find the moment generating function and the result of the of rolling the pair of dice where k=2, therefore
M_x (t)=1/6^2 〖(e^t+e^2t+⋯+e^6t)〗^2
= 1/36 〖(e^2t+e^3t+e^4t+e^5t+e^6t+e^7t+e^8t+e^9t+e^10t+e^11t+e^12t)〗^2
Conclusion:
The most probable sum resulted from rolling pair of dice is seven with the ratio of 6/36, and the least probable sum resulted is two with the ratio of 1/36. This experiment used two main methods to come out with the best result: Probability Distribution Function, and Moment Generating Function. Dice probability has made it easy to find the result of the experiment, and as the study of “The Probability Distribution of the Sum of Several Dice: Slot Applications.” has proved my results by using probability rules. Comparing my results to the study results I referred to showes that once the concepts and the rules of probability study is correct then the result of the experiment must be correct as well. Therefore, we notice that probability is a really important mathematical method that we must learn about because it helps us to come up with the most cocurate solution of any experiment. Dice probability experiment has helped to make probability concepts much easier to understand, and this experiment can easily help anyone to understand probability.
Work Cited:
Singh, A. K., Dalpatadu, R. J., & Lucas, A. F. (2011). The Probability Distribution of the Sum of Several Dice: Slot Applications. UNLV Gaming Research & Review Journal, 15(2), 109–118. Retrieved from https://search-ebscohost-com.ccny-proxy1.libr.ccny.cuny.edu/login.aspx?direct=true&db=a9h&AN=69735833&site=ehost-live
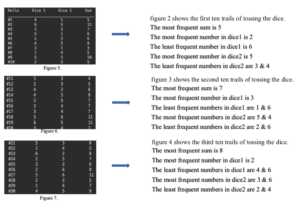
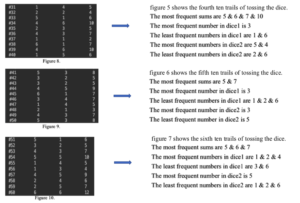
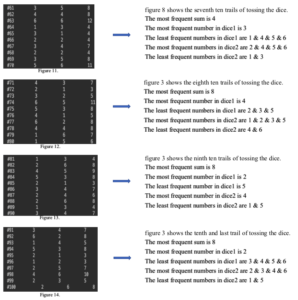
Appendix:
This is the outcome of the program when executed. I have divided the into ten trails, each trail will have most frequent sum, most frequent numbers, and least frequent numbers of dice1 and dice2 shown in the figures below:

This entry is licensed under a Creative Commons Attribution-NonCommercial-ShareAlike 4.0 International license.